When you enable the "Data Lines.Suppress" object property in tables, all data lines are completely suppressed. This option is particularly useful in combination with the "Force Sums" option. The latter option specifies that totals are also calculated when a data line is not printed. By combining both options, you can output footer lines with totals and produce interesting statistics in this way.
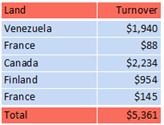
Let's assume that you want to output the turnover per country:

Figure 6.60: Creating statistical reports with footers
Proceed as follows in the Sample Application:
1. Create a new element in the report container and choose "Table" as the object type.
2. In the following dialog, now select the data source. All available tables are shown hierarchically, in other words, under the tables you will find the relational tables in each case.
To evaluate sales per country, for example, choose the "Orders > Order Details" table so that you have both tables at your disposal. The "Customers" table has a 1:1 relationship with the "Orders" table so you don't need to select it. The turnover is held in the "Order_Details" table.

Figure 6.61: Hierarchical tables for statistical reports
3. Create a data line with the "OrderID" field in the "Orders.Order_Details" table. Although the data line is not output (it is suppressed), but it still needs a field so that the table can be printed at all.
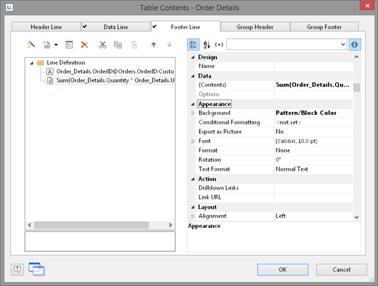
4. Define the actual statistic as a footer line, i.e. with the country name in the first column, and total the turnover in the second column. Now calculate the total again with the "Sum(Order_Details.Quantity * Order_Details.UnitPrice)" formula.

Figure 6.62: Creating footer lines for a statistical report
5. In the "Orders" table, create a data line with the "Country" field from the linked table "Customers". Although the data line is not output (it is suppressed), but it still needs a field so that the table can be printed at all.
6. Define the grand total across all countries as a footer line, i.e. with "Total" in the first column, and total the turnover again in the second column.
7. Now select the "Orders" table in the "Objects" tool window and set the "Data Lines.Suppress" property to "Yes".
8. Finally, also select the "Orders" table and set the "Data Lines.Suppress" property to "Yes" here as well.

Figure 6.63: Suppressed data lines for statistics