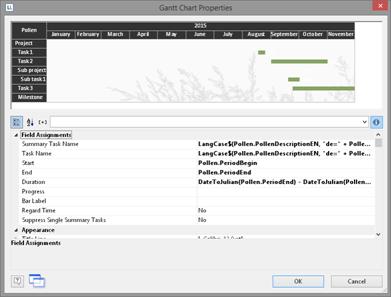
In the "Field Assignments" area first select the groupings for the lines and columns, i.e. the tasks and the time axis.
Please note: No aggregate functions or LL.FCount fields can be used in a Gantt chart.
1. Select the "PollenDescriptionEN" field as the summary task name in the formula wizard. The summary task name defines a superior operation in a project, e.g. main projects and sub-projects. If you do not want to indicate any summary tasks, enter the same value you entered under "Task Name".
Please note: A summary task must always be a real record which can either come from the "Base Table" or from the table that the Gantt chart itself is based on.
2. Please select the "PollenDescriptionEN" field as the task name in the formula wizard. The task name defines the task; in the case of pollen, examples could be alder or hazel.
Please note: In the case of multiple tasks in a single line (e.g. a holiday plan layout), these records must be separated from one another successively, i.e. the records must be sorted.
3. Please choose the "PeriodBegin" field for the beginning of the task. For summary tasks (i.e. tree-pollen for example), this value is automatically placed at the beginning of the first task.

Figure 6.59: Properties of the Gantt chart
4. Select the "PeriodEnd" field for the end of the task. For Summary Tasks (i.e. tree-pollen for example), this value is automatically placed at the end of the last task. The task is interpreted as a milestone, if the end time corresponds with the start time and the duration is 0.
5. Select the duration of a task in days. In our example, the difference of start and end: DateDiff(Pollen.PeriodEnd,Pollen.PeriodBegin). With summary tasks this is calculated with the difference between the days.
6. Select the progress of an action if you would like to indicate this value (e.g. with a project task).
7. Various layout options are available in the "Appearance" area:
§ Define the background and font of the title row, summary task row and task row.
The color of the bar is defined via the property "Task Rows > Row Properties > Filling (Unfinished) > Color". It is possible to define a formula to fill in areas with different colors, e.g. Cond(Pollen.PeriodType=1,LL.Scheme.Color3 ,Cond(Pollen.PeriodType=2,LL.Scheme.Color8,LL.Color.Red))
§ Under "Table Area" you can specify which additional values should be indicated in the columns. The selection includes an ongoing index, the task name, the start of the task, task duration, end of task and task progress.
§ Define the indicated time period under "Chart Area". For our pollen chart we will select "Months". The superordinate unit of time is "Years". With a project chart the example would be "Days" as time unit with the superordinate unit being "Months".
§ Please also refer to the Overview of Properties chapter.
8. Furthermore, you can define the page break behavior for columns and lines, as Gantt charts are often wider than the assigned page format. It creates as many extra pages (shadow pages) as necessary. In this process, the line identifiers are uniformly repeated on all pages, but the column identifiers are not repeated.
The following break properties are available:
§ Page Break on Shadow Pages: If the Gantt chart becomes too wide, the wrapped parts are printed on shadow pages. A shadow page does not count as a "real" page and therefore does not have a page number. The default setting specifies that the wrapped parts are to be output below the table.
§ Repeat Labels: Specify whether or not the labels of lines should be reprinted in the case of a page break.
§ Break Evenly: Specify whether a page break should run on to the edge of the time interval (e.g. month).